Normal Distribution Calculator
Calculate the probability for a given value based on the normal distribution.
Result
Probability (P(X)): -
Z-Score: -
In the world of statistics, understanding the normal distribution is crucial for analyzing data. Whether you are a student, a data analyst, or just someone interested in probability and statistics, having access to a normal distribution calculator can make your life a lot easier. In this article, we will explore the importance of normal distribution, how to use a normal distribution calculator, and delve into other related tools like the Gaussian distribution calculator and normal deviation calculator. By the end of this guide, you’ll be equipped to perform statistical calculations with ease and confidence.
What is a Normal Distribution?
The normal distribution is a probability distribution that is symmetric around the mean, meaning it follows a bell-shaped curve known as the normal curve. It is one of the most important concepts in statistics because it is used in many statistical analyses, from hypothesis testing to machine learning models.
The key characteristics of the normal distribution are:
- The mean, median, and mode are all equal and located at the center of the distribution.
- It is symmetrical, meaning the left and right sides are mirror images.
- The total area under the curve is equal to 1, representing 100% probability.
To calculate probabilities or find z-scores, a normal distribution calculator is invaluable.
Why You Need a Normal Distribution Calculator?
Calculating probabilities by hand using the normal distribution can be time-consuming and error-prone. Fortunately, with the help of a normal distribution calculator, you can quickly compute probabilities, find z-scores, and visualize the data for accurate insights. This tool is especially useful for:
- Data analysis: Quickly determining the likelihood of a given data point.
- Statistical testing: Essential for hypothesis testing in fields like research and engineering.
- Risk assessment: Useful for understanding risk factors in finance and insurance.
How Does a Normal Distribution Calculator Work?
A normal distribution calculator typically works by taking three inputs:
- Mean (μ): The average of your data.
- Standard deviation (σ): A measure of how spread out the data is.
- Value (X): The data point for which you want to calculate the probability.
The calculator will use these inputs to:
- Calculate the Z-score: This tells you how far away a value is from the mean, measured in standard deviations.
- Find the cumulative probability: This represents the area under the curve to the left of the given value.
The formula for the Z-score is:
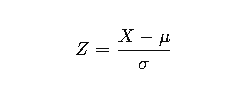
Where:
- XXX is the data point
- μ\muμ is the mean
- σ\sigmaσ is the standard deviation
Example Calculation Using a Normal Distribution Calculator
Let’s walk through an example. Suppose you want to calculate the probability of a value of X = 70 in a dataset with a mean of 65 and a standard deviation of 5.
- Calculate the Z-score: Z=70−65/5 = 1
- Find the cumulative probability using the calculator (or a Z-table).
For a Z-score of 1, the cumulative probability is approximately 0.8413. This means there is an 84.13% chance that a randomly selected value will be less than 70.
Gaussian Distribution and Normal Deviation Calculators
While the normal distribution calculator is widely used, you might also need other specialized calculators depending on the data you’re working with. Two popular alternatives are the Gaussian distribution calculator and the normal deviation calculator.
Gaussian Distribution Calculator
The Gaussian distribution, often used interchangeably with the normal distribution, refers to the same bell-shaped curve used in statistics. A Gaussian distribution calculator is used to compute probabilities and Z-scores, particularly for datasets that are expected to follow the Gaussian distribution.
Normal Deviation Calculator
The normal deviation calculator helps compute the standard deviation of a dataset or distribution. It’s crucial for understanding how much variation or “spread” exists in the data, which in turn helps calculate the likelihood of certain events occurring.
Step-by-Step Guide to Using a Normal Distribution Calculator
Follow these steps to use a normal distribution calculator effectively:
- Enter the Mean (μ): This is the average value of your dataset.
- Input the Standard Deviation (σ): This measures how spread out your data is.
- Specify the Data Point (X): This is the value for which you want to find the probability.
- Hit Calculate: The calculator will return the Z-score and cumulative probability.
- Interpret the Results: A higher cumulative probability means the value is closer to the mean, while a lower value indicates it’s more extreme.
Tip: Use the Z-Score Table
If you’re unsure about the cumulative probability, most normal distribution calculators will automatically provide the Z-score table for reference. The Z-score table helps find probabilities based on the Z-score, saving you time in manual calculations.
Key Benefits of Using a Normal Distribution Calculator
- Time-saving: Eliminates the need for manual calculation.
- Accuracy: Reduces human error and ensures accurate statistical results.
- Ease of use: Most calculators have user-friendly interfaces, making them accessible even to beginners.
- Visualization: Many tools offer graphs and charts, helping you visualize data distribution.
FAQs
Q: What is the normal distribution in statistics?
A: The normal distribution is a bell-shaped curve that shows how data is distributed around the mean, with most values falling close to the mean.
Q: How can I calculate probabilities using a normal distribution calculator?
A: Simply enter the mean, standard deviation, and data point value, and the calculator will provide the cumulative probability and Z-score.
Q: What’s the difference between a normal and Gaussian distribution?
A: There is no significant difference. Both refer to the same bell-shaped curve, with Gaussian distribution being another name for the normal distribution.
Q: Can I use a normal distribution calculator for large datasets?
A: Yes, normal distribution calculators are effective for both small and large datasets, provided they follow the normal distribution.
In conclusion, a normal distribution calculator is an essential tool for anyone dealing with statistical analysis. Whether you’re calculating probabilities, determining Z-scores, or simply exploring data trends, this tool simplifies the process and ensures accurate results.
If you found this guide helpful, explore more useful tools and calculators on Toolrify. Stay updated and subscribe to our blog for expert insights on using statistical tools effectively.